
Google Charts
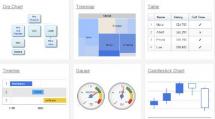
Google Charts provides a way to visualize data on a website. One can use anything from simple line charts to complex hierarchical tree maps, and there is a chart gallery which provides a large number of ready-to-use chart types.
The most common way to use Google Charts is with simple JavaScript that is embedded into a web page. The users loads some Google Chart libraries, lists the data to be charted, selects options to customize a chart, and finally creates a chart object.
One can use Google Chart Tools with their default setting – all customization is optional and the basic setup is launch-ready. However, charts can be easily customizable as well. The site walks the user through each step.
Last modified: July 23, 2021
Language: English